So, you’re ready to up your game and make sure you never miss a critical update? Great choice! Setting up Grafana alerts and integrating them with Slack and Jira through n8n is a powerful way to keep your team on the ball. Let’s dive in and get those workflows automated!
Setting Up Grafana Alerts
First up, let’s get your Grafana alerts configured so you’re always in the know. Here’s the lowdown on how to get your alerts up and running:
Pick Your Data Source
Start by selecting where your data is coming from. Grafana’s got your back with a bunch of data source options.
Query Your Data
Dive into the data you want to keep an eye on. Use queries to drill down to the metrics or logs you care about.
Normalize Your Data
Get your data in shape! Make sure it’s consistent and ready for analysis.
Set Your Threshold
Define what makes your alert go off. What’s the magic number or condition that means it’s time to pay attention?
Create Queries, Expressions, and Conditions
Craft the queries and set the conditions that will trigger your alert.
Note: Expressions are a Grafana-managed feature, so they’re only available if you’re using Grafana’s own alerting.
How Should Your Alerts Be Evaluated?
Decide how often you want Grafana to check if your alert conditions are met. More frequent checks mean quicker notifications, but it might also mean more noise.
Labels and Notifications
Think about how you want to route your alerts. Adding labels can help you categorize and find your alerts more easily.
Annotations
Want to add a little extra detail? Annotations let you include context in your notifications—like what caused the alert and which server it came from.
Ready to get started? With these steps, you’ll be on top of your data in no time!
Configure Grafana-managed alert rules
Grafana-managed alerts are super flexible and let you pull data from any of our supported data sources. You can even combine data from different sources in one alert rule and use expressions to tweak your data and set up your alert conditions. Plus, you can include images in your notifications. Here’s how you can create and manage these alerts:
Step 1: Set Alert Rule Name
Click on Alerts & IRM -> Alert rules -> + New alert rule.
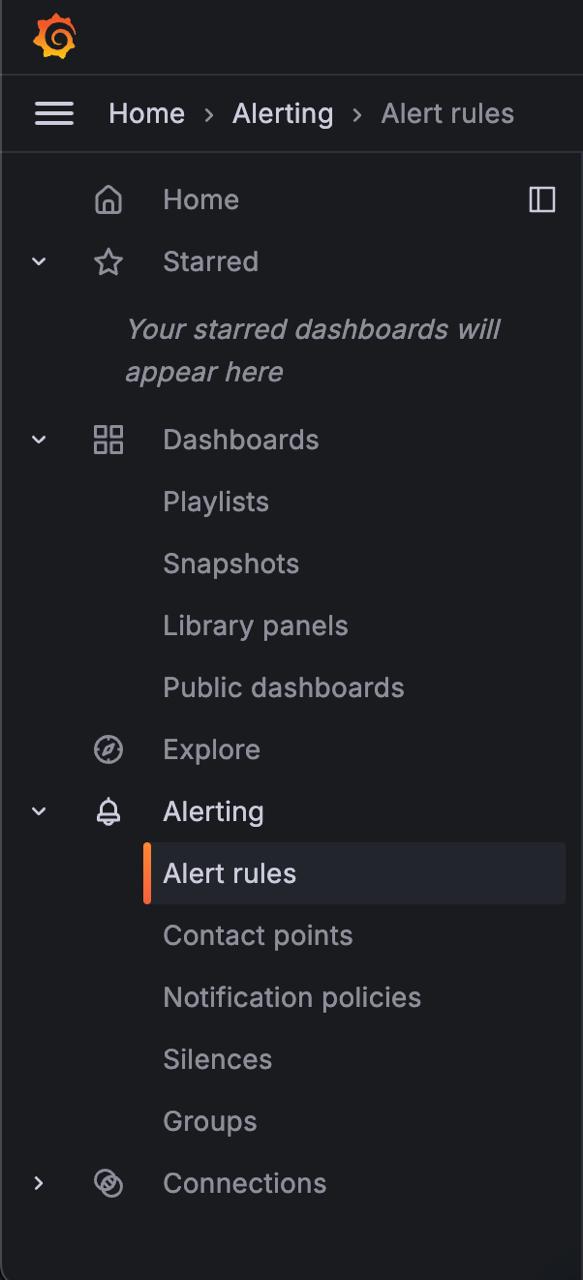

Enter a name for your alert rule.
This name helps you identify it in your list and shows up as the
alertnamelabel for all alerts created from this rule.
Step 2: Define Query and Condition
Set up a query to fetch the data you want and define a condition that must be met before the alert triggers.
Pick a data source.

Choose a time range from the Options dropdown.
Note: Grafana Alerting supports fixed relative time ranges like
now-24hr: now, but not absolute time ranges (e.g.,2021-12-02 00:00:00 to 2021-12-05 23:59:59) or semi-relative time ranges (e.g.,now/d to: now).
Add a query.
To add more queries, click Add query.
All alert rules are managed by Grafana by default. If you prefer data source-managed alert rules, click Switch to data source-managed alert rule.

Add one or more expressions.
a. Choose either Classic condition for a single alert rule or select Math, Reduce, and Resample options for separate alerts per series.
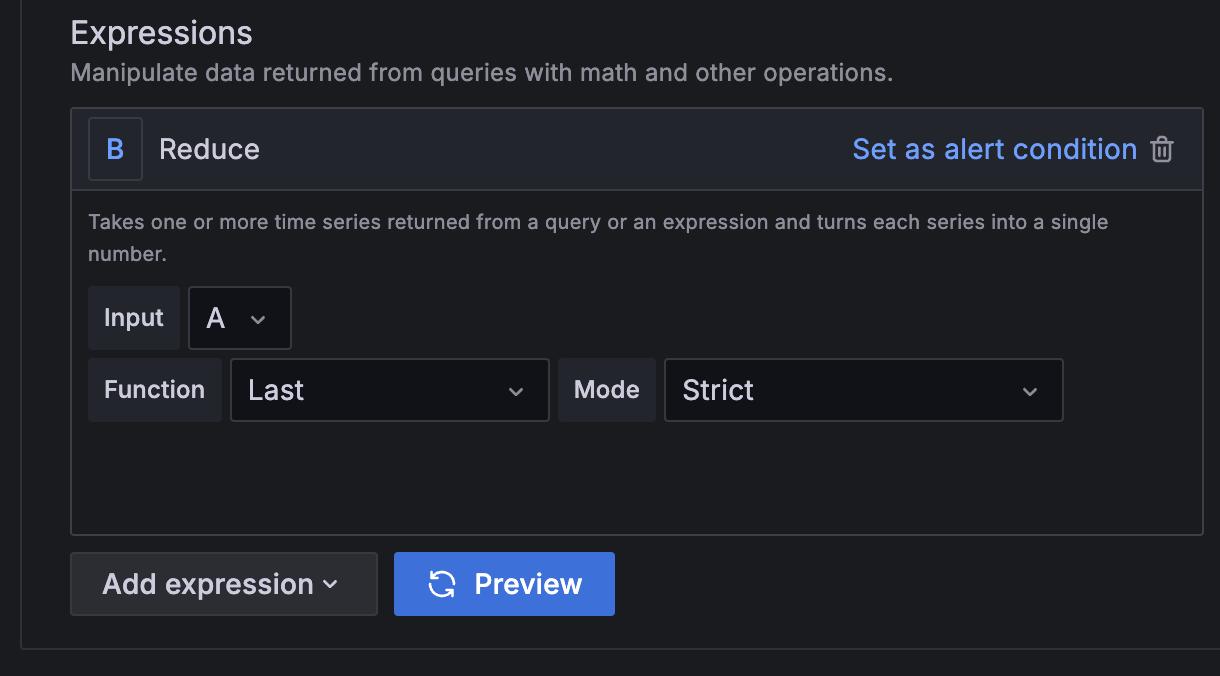
b. Click Preview to check if the expression is working.
To add a recovery threshold, turn on the Custom recovery threshold toggle and enter a value for when your alert rule should stop firing.
You can only add one recovery threshold in a query, and it must be the alert condition.
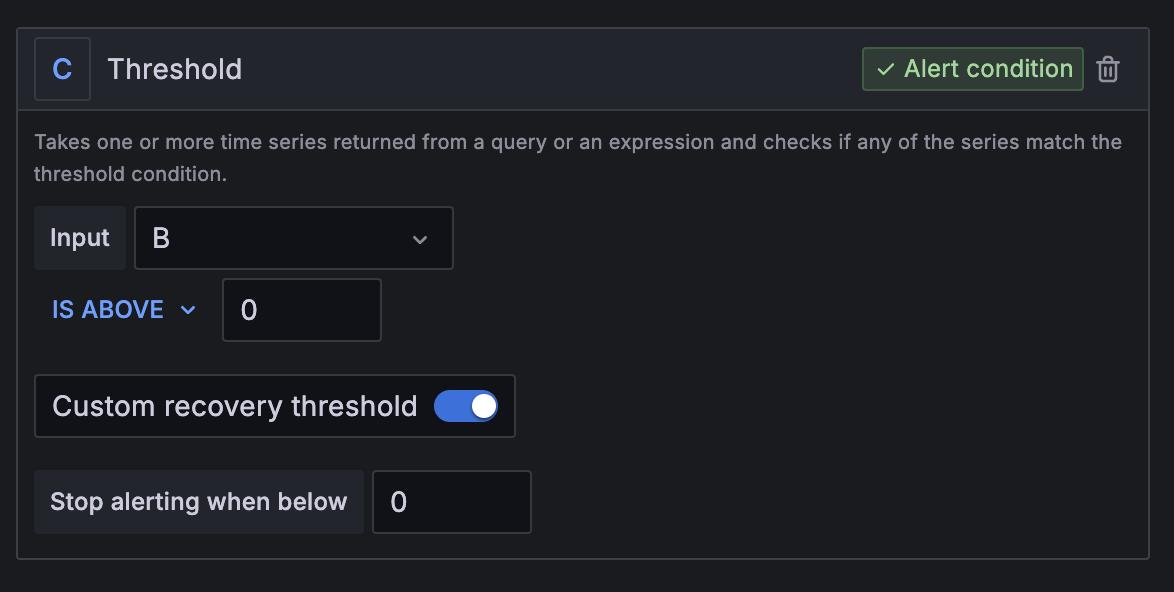
Click Set as alert condition on the query or expression you want to use as your alert condition.

Step 3: Set Alert Evaluation Behavior
Determine how often the alert rule should be evaluated and how quickly it should change its state.
Choose a folder or click + New folder.

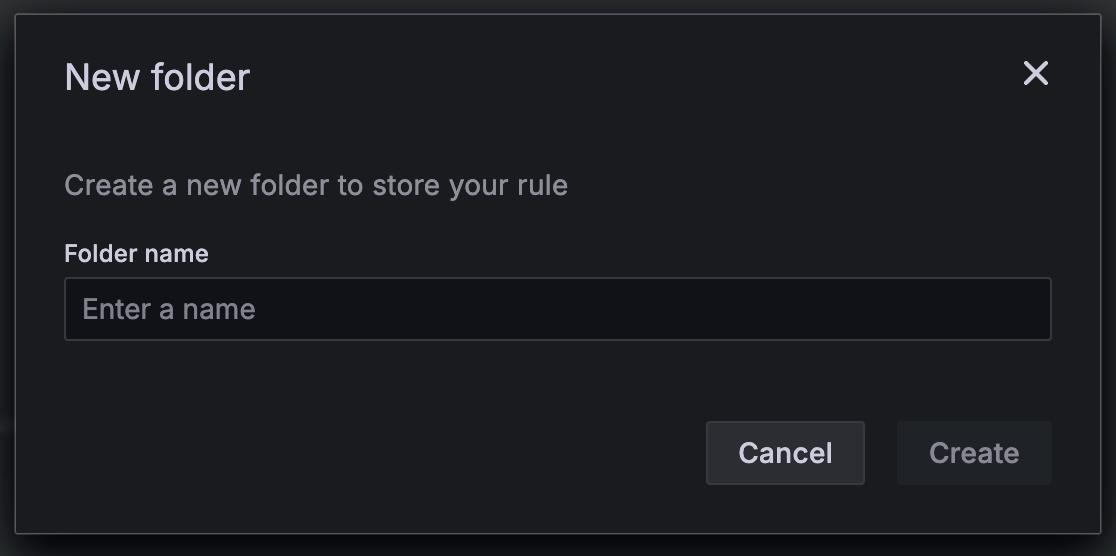
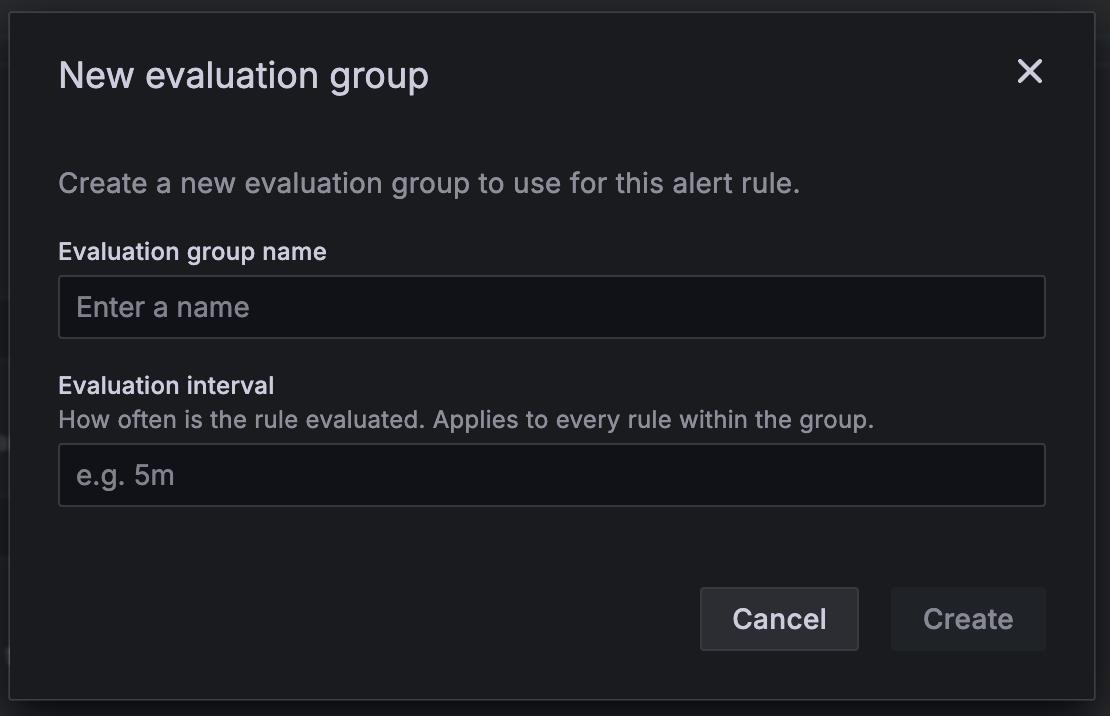
Select an evaluation group or click + New evaluation group.
If you’re creating a new evaluation group, set the interval for the group.
All rules within the same group are evaluated together over the same time interval.

Set a pending period.
The pending period is how long an alert rule can be in breach of the condition before it triggers.
Once the condition is met, the alert goes into the Pending state. If it stays active for the entire pending period, it changes to the Firing state; otherwise, it goes back to the Normal state.

Turn on pause alert notifications if needed.
Note: You can pause alert rule evaluation to avoid noisy alerts while you’re tuning them. Pausing stops evaluation and doesn’t create alert instances. This is different from mute timings, which stop notifications but still allow evaluation and creation of alert instances.

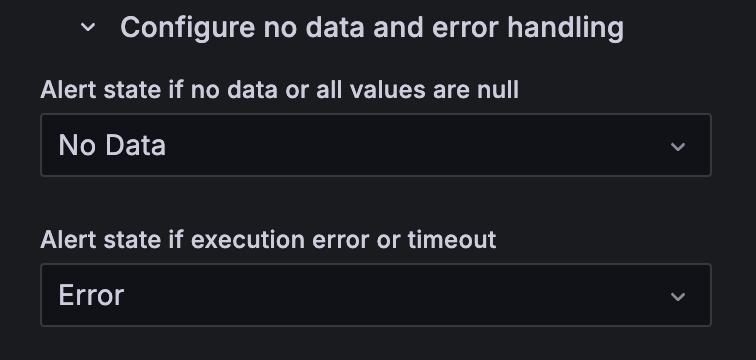
In Configure no data and error handling, set how you want the alert to behave when there’s no data.
Step 4: Configure Labels and Notifications
Add labels to organize your alert rules and set up notification policies for your alerts.
Add labels if needed.
You can select existing key-value pairs from a dropdown or enter new ones.

Choose how notifications are sent when an alert fires by either selecting a contact point or using a notification policy.

Select contact point
a. Pick this option to select an existing contact point. All notifications for this alert rule will go to this contact point automatically, bypassing notification policies.
b. Optionally, select a mute timing and groupings to define when notifications shouldn’t be sent.
Note: An auto-generated notification policy is created. Only admins can view these auto-generated policies in the Notification policies list view. Any changes need to be made in the alert rules form.
Use notification policy
a. Choose this to use the notification policy tree for routing notifications.
Note: All alert rules and instances follow the default notification policy. If there are no nested policies or if no nested policies match the labels in the alert rule or instance, the default policy is used.
b. Preview your alert instance routing setup.
Based on the labels added, alert instances will be routed according to the notification policies shown.
c. Expand each notification policy below to view more details.
d. Click See details to check alert routing details and an email preview.
Step 5: Add Annotations
Add annotations to provide extra context in your alert notification messages.
Annotations add metadata to give more information about the alert. For instance, a Summary annotation can explain which value caused the alert or which server it happened on.
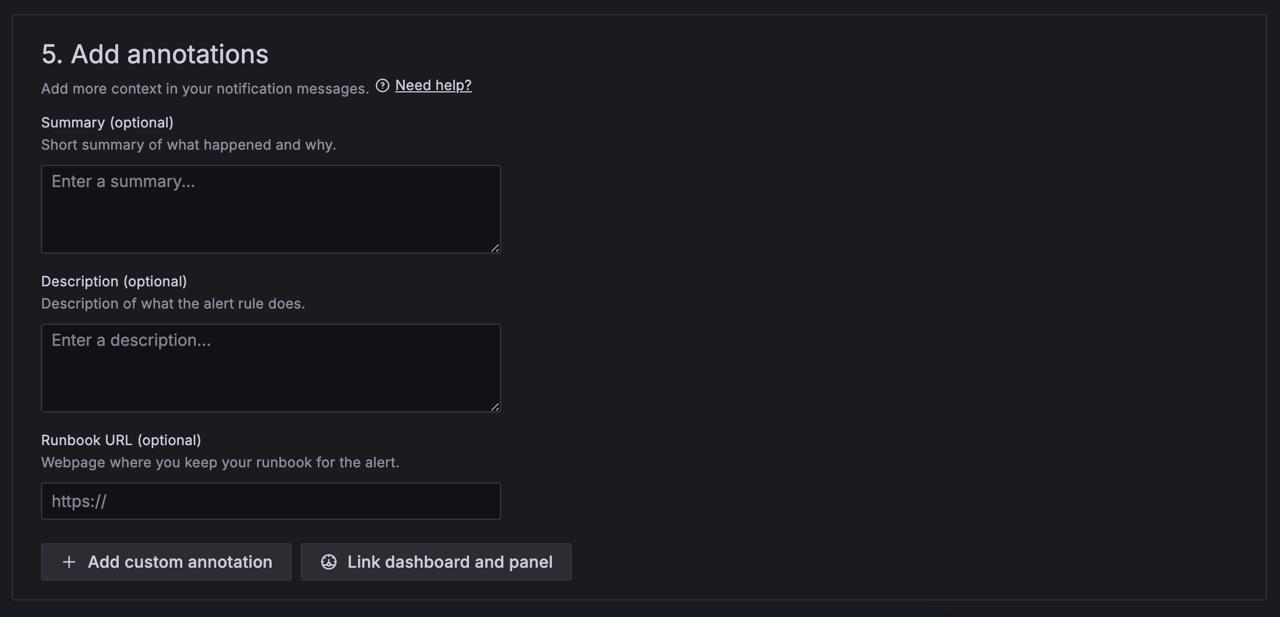
- Optional: Add a summary. A brief explanation of what happened and why.
- Optional: Add a description. Detail what the alert rule does.
- Optional: Add a Runbook URL. A webpage link to your runbook for the alert.
- Optional: Add a custom annotation.
- Optional: Add a dashboard and panel link. Link alerts to specific panels in a dashboard.
Note: Currently, alerts are supported only in time series and alert list visualizations.
- Click Save rule.
Configure Contact Points
Use contact points to pick how you want to get notified when your alert rules go off. You can add, edit, delete, export, and test a contact point.
Step 1: Add a Contact Point
Here’s how to add a contact point:
In the left-side menu, click on Alerts & IRM and then Alerting. Click on Contact Points.
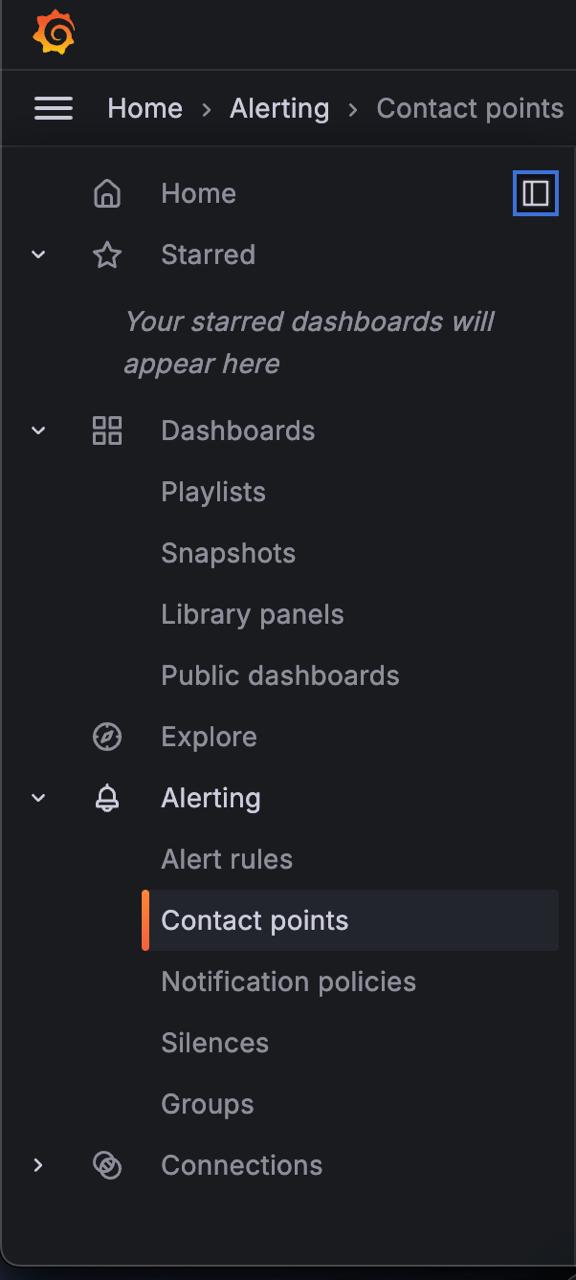
From the Choose Alertmanager dropdown, pick an Alertmanager. Grafana Alertmanager is the default option.

On the Contact Points tab, click + Add Contact Point.

Enter a name for your contact point.
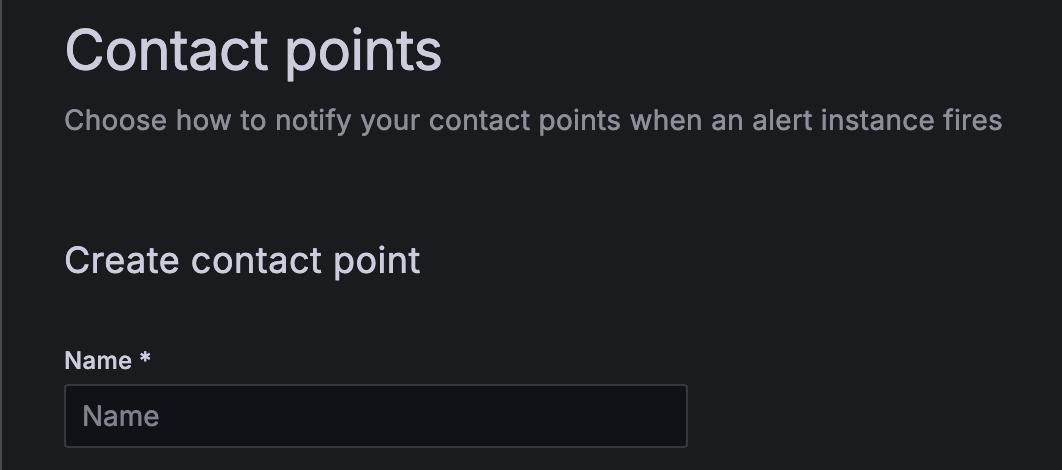
From Integration, select the type and fill in the required fields. For example, if you choose email, enter the email addresses. Or if you choose Slack, enter the Slack channel and the users you want to contact.

Some integrations, like email or Webhook, have optional settings. In Optional Settings, you can add extra settings for the integration.

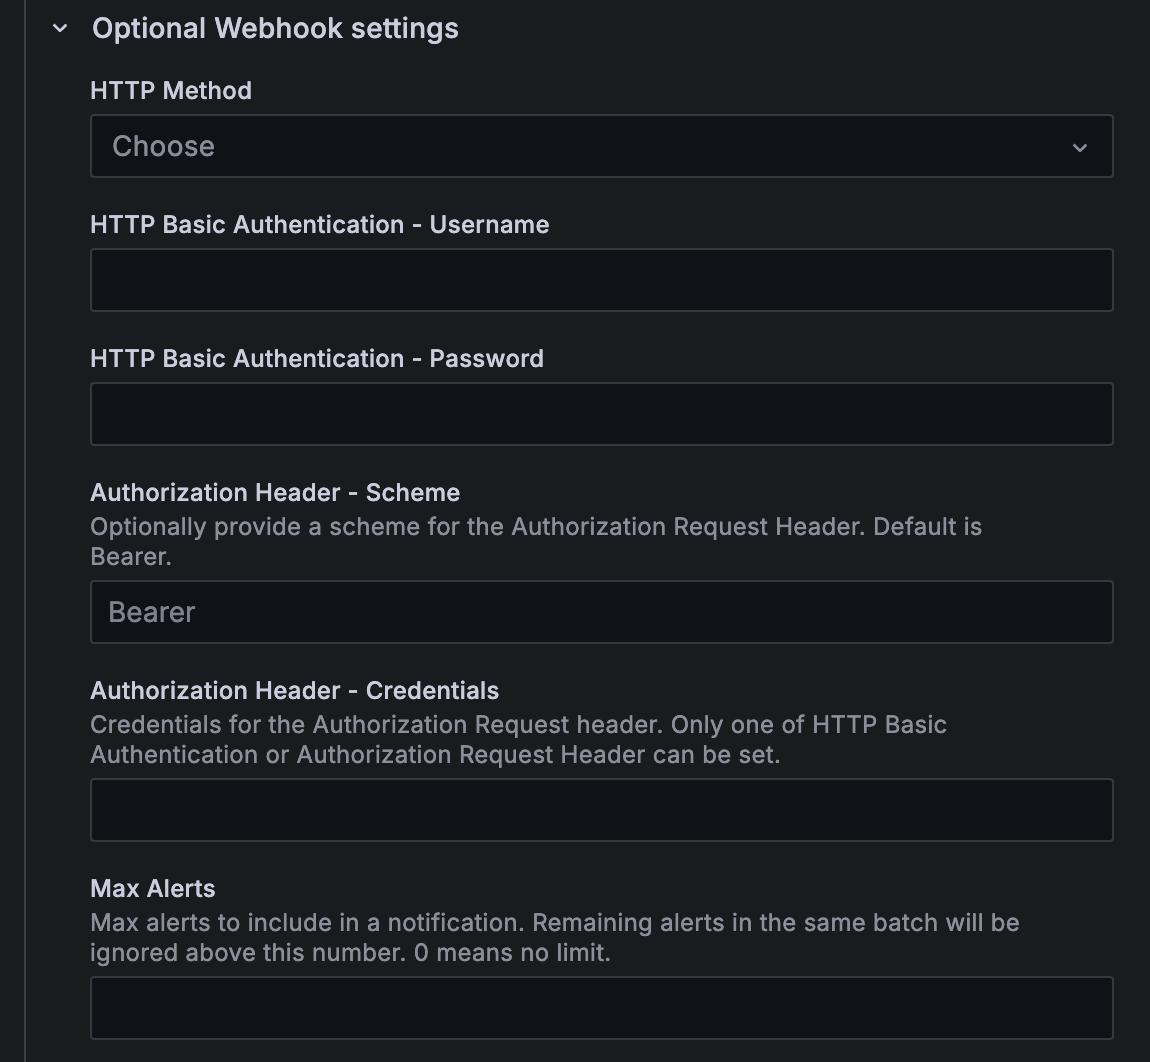
In Notification Settings, you can choose to Disable Resolved Message if you don’t want to be notified when an alert is resolved.

If you want to add another contact point integration, click Add Contact Point Integration and repeat steps 6 through 8.
Save your changes.
Step 2: Test a Contact Point
Here’s how to test a contact point:
- In the left-side menu, click on Alerts & IRM and then Alerting.
- Click on Contact Points to see your list of contact points.
- Find the contact point you want to test, then click Edit. You can also create a new contact point if needed.
- Click Test to open the testing dialog box.

- Choose whether to send a predefined test notification or go custom by adding your own annotations and labels.
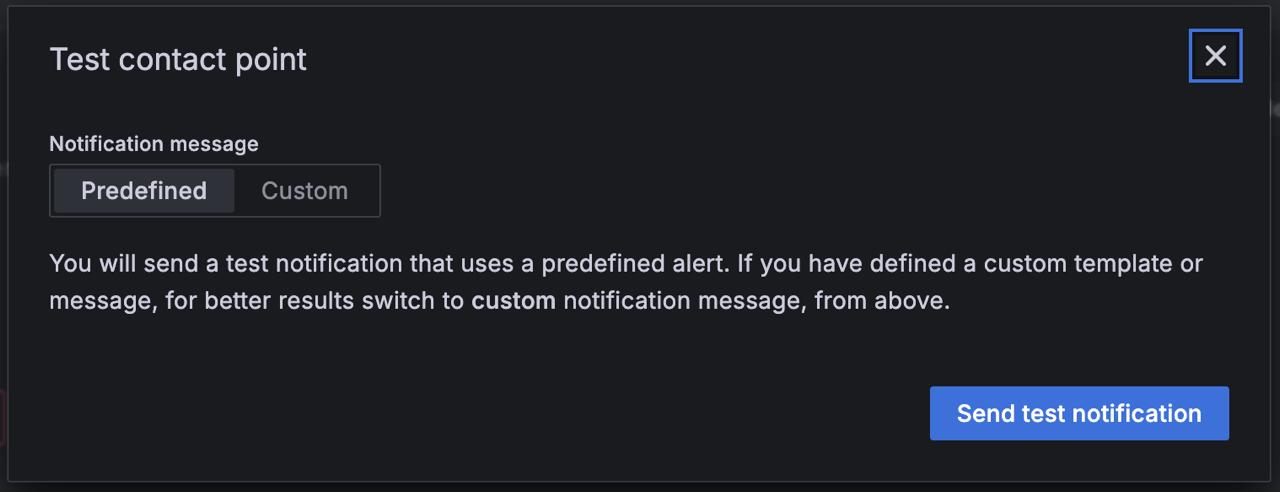
- Click Send Test Notification to trigger the alert.
Configure Notification Policies
Notification policies help you decide how alerts are sent to your contact points. They work in a tree-like structure where each policy can have one or more nested policies. Except for the default policy, each one can match specific alert labels.
Step 1: Add a Nested Policy
You can create a nested policy under the default one or under any existing nested policy. Here’s how you do it:
Go to the left-side menu and click Alerts & IRM, then Alerting. Click Notification policies.
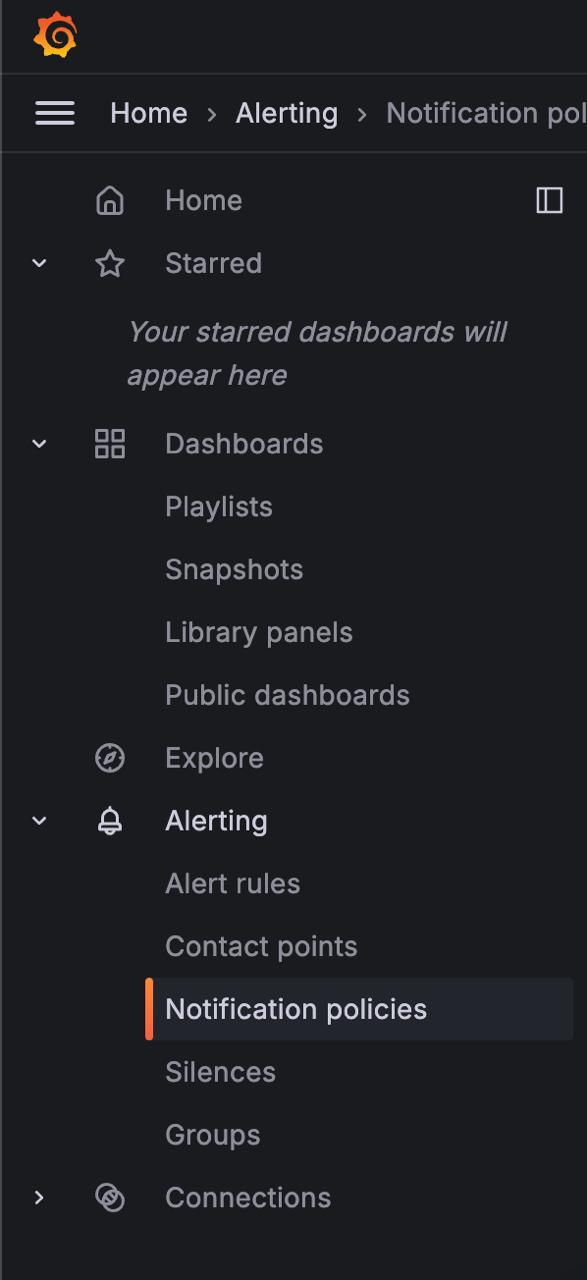
Click +New nested policy from the default policy.

In the Matching labels section, add one or more rules to match alert labels.

From the Contact point dropdown, choose the contact point to send notifications to if an alert matches this specific policy and not any nested policies.
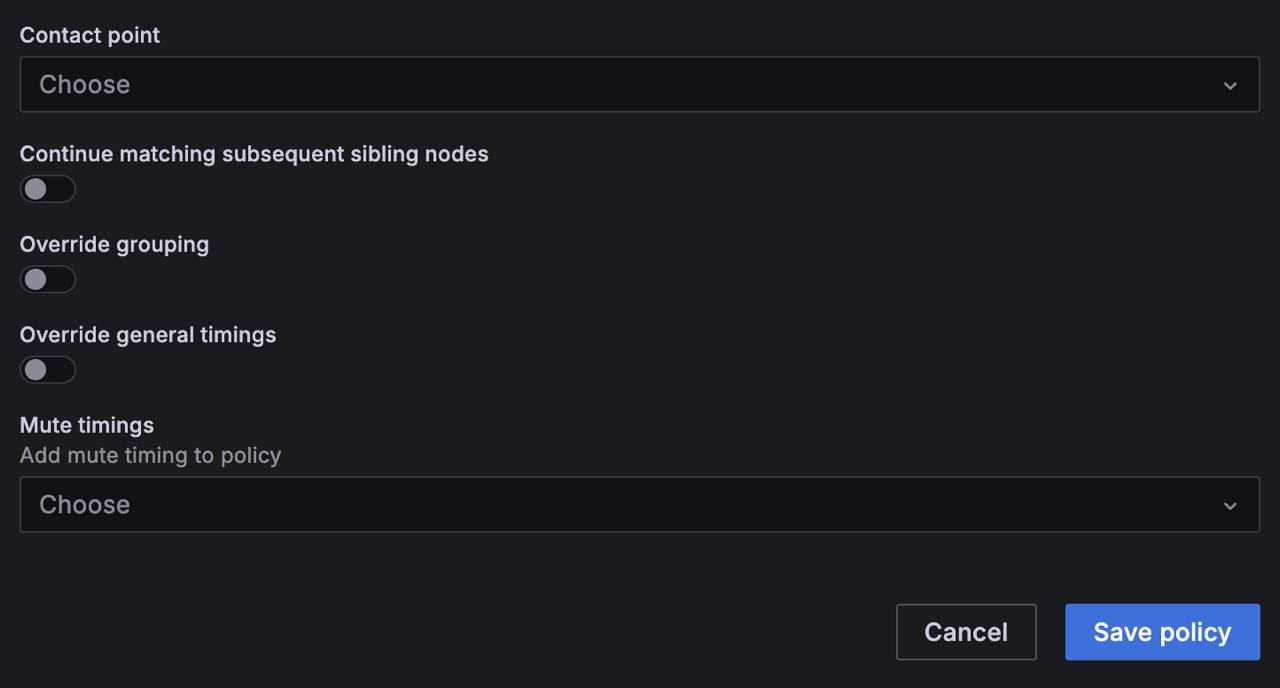
[Optional] If you want alerts to keep matching sibling policies after finding a match, enable Continue matching subsequent sibling nodes. This option can result in multiple notifications for the same alert.
[Optional] To use the same grouping settings as the default policy, enable Override grouping. If this isn’t enabled, it’ll use the default policy’s grouping settings.
[Optional] To override the timing options set in the group notification policy, enable Override general timings.
Click Save policy to apply your changes.
Build Your n8n
Create custom workflows between Grafana, Slack, and Jira by picking triggers and actions. Each node comes with general settings, plus app-specific options you can tweak. You can also use the HTTP Request node to pull data from any app or service with a REST API. Ready to bring it all together? Here’s how you can set up a workflow:
How to Connect Grafana, Slack, and Jira
Step 1: Set up n8n
First, make sure n8n is installed and running:
- Install n8n on any platform using npm or Docker.
- Or, let n8n handle it for you with its cloud hosting.
Step 2: Create a New Workflow to Connect Grafana, Slack, and Jira
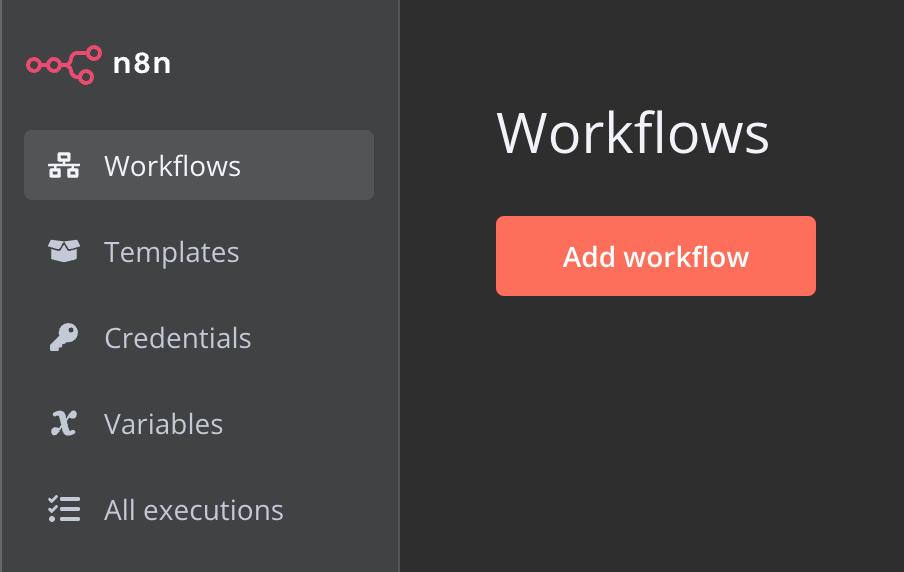
Open n8n, go to the Workflows tab, and click Add workflow to start a new one.
Step 3: Add the First Step
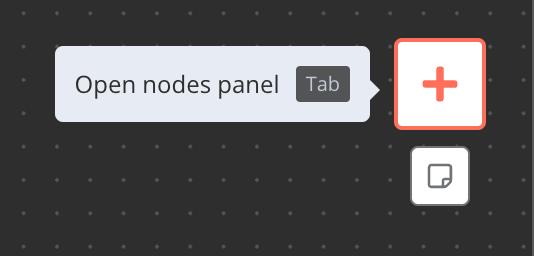
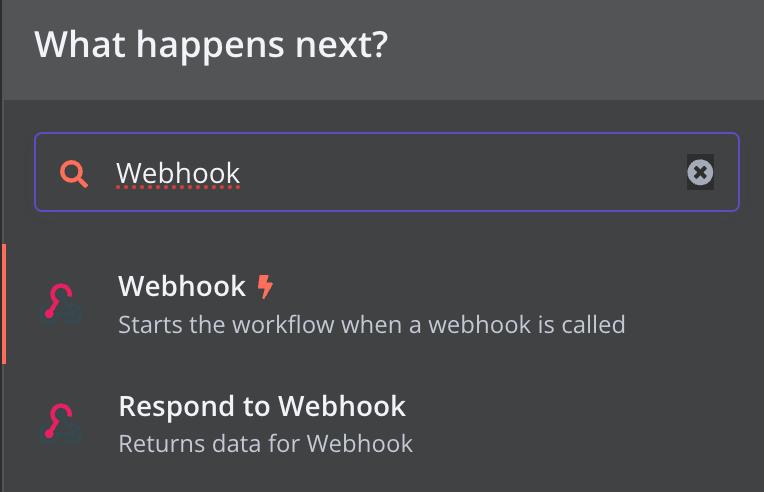
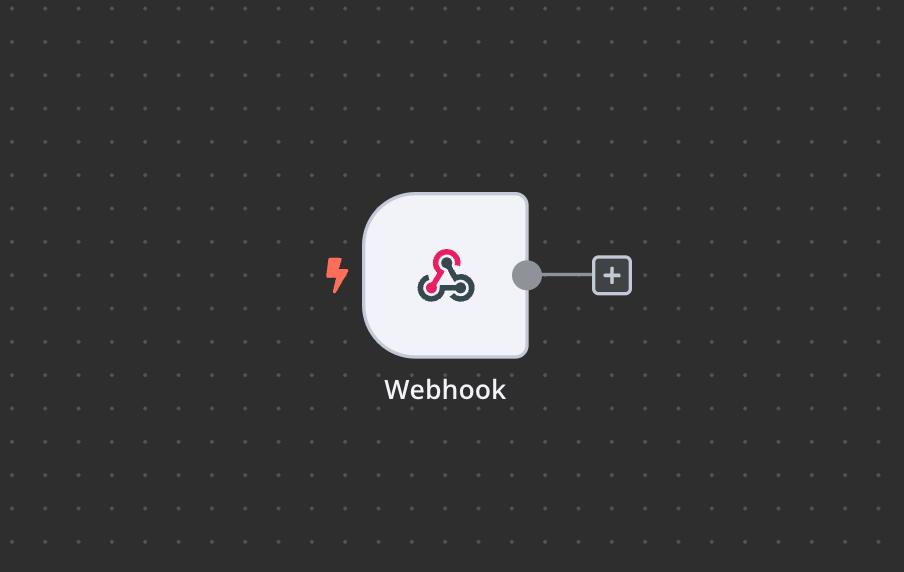
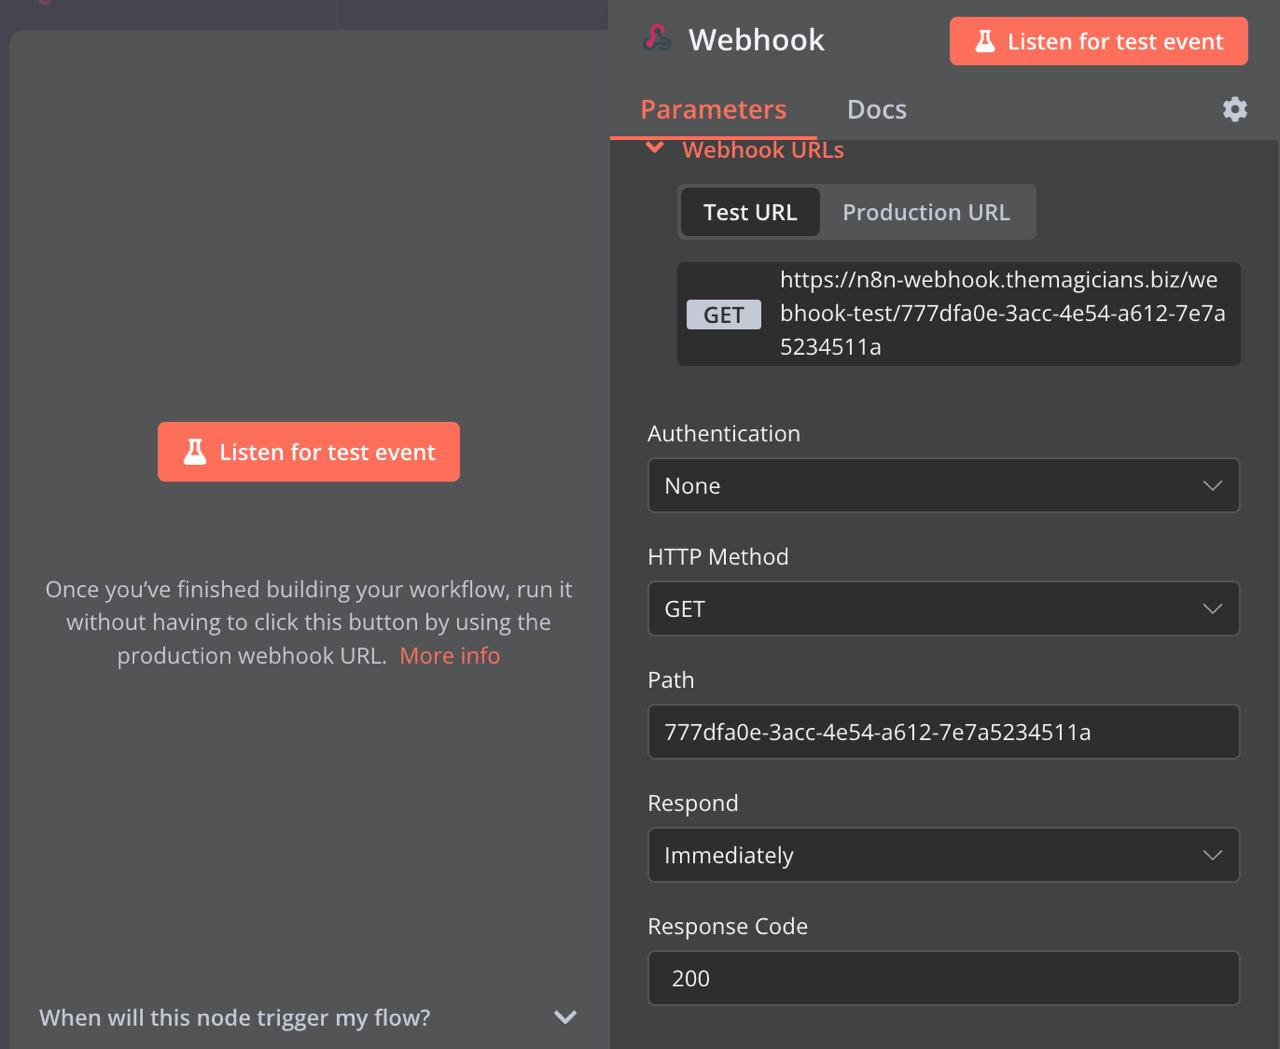
Decide what will kick off your workflow: a schedule, a webhook call, another workflow, or manually. Sometimes Grafana, Slack, or Jira can be your starting point. Just click Open nodes panel, search for Grafana, Slack, or Jira, or choose a trigger. For this case, drag the webhook node onto the canvas—it’ll serve as the contact point. Just like before, copy and paste the URL there.
Step 4: Add the Slack Node
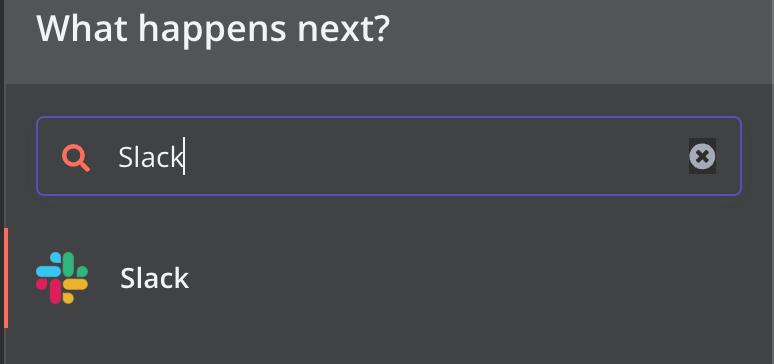
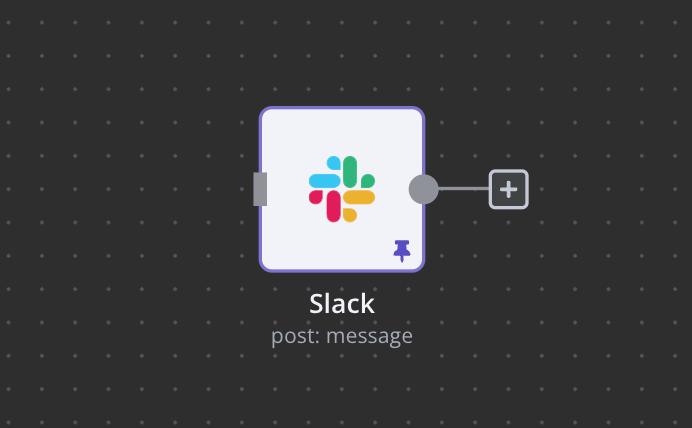
Drag the Slack node onto the canvas. Choose what you want Slack to do before dragging.
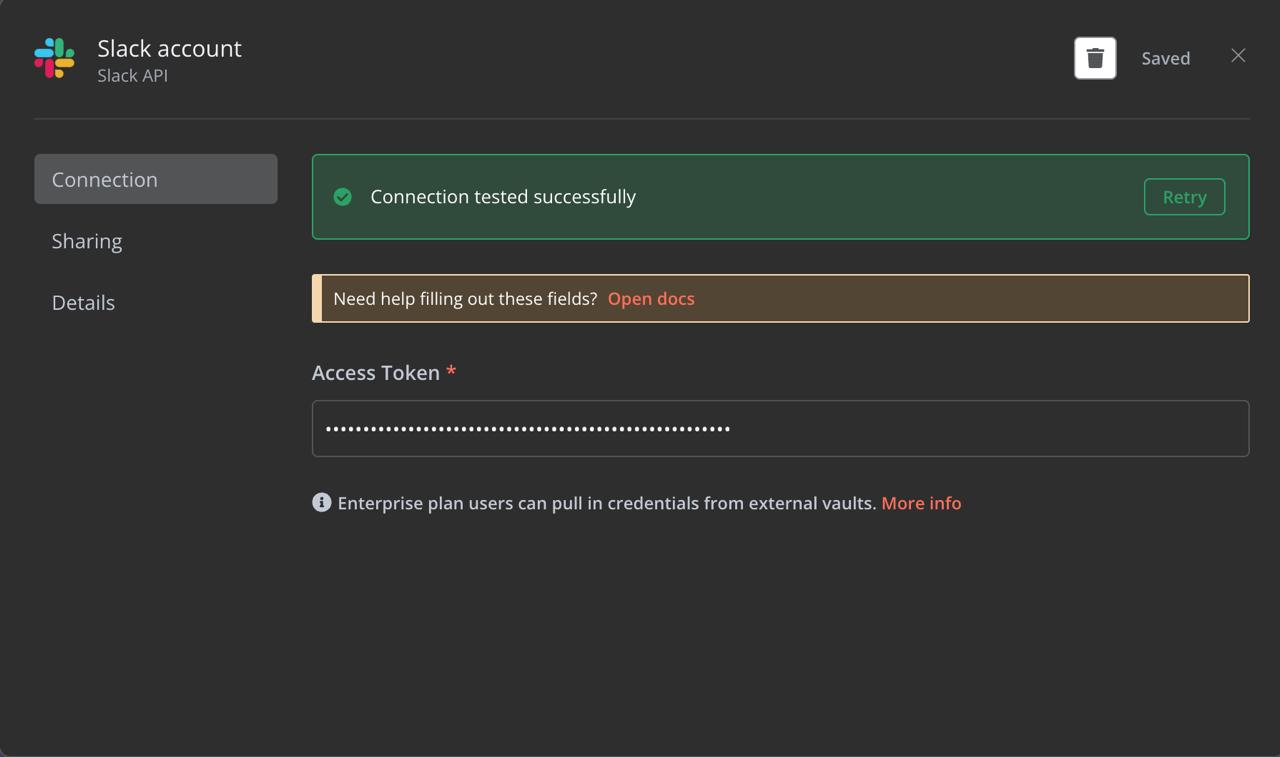
Step 5: Authenticate Slack
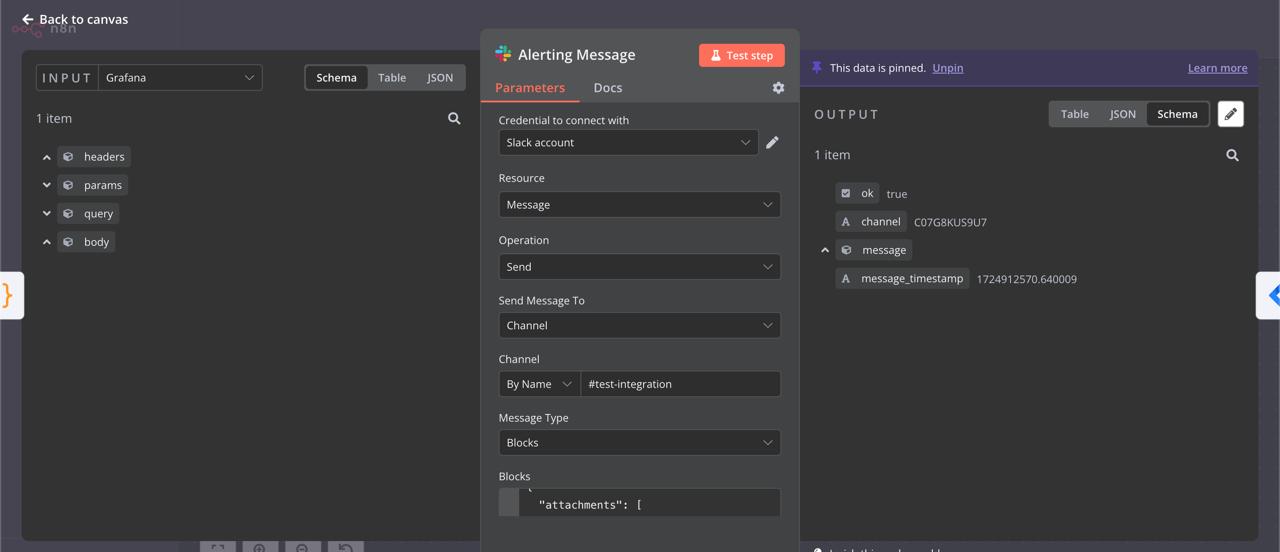
Click on the Slack node, then select Select credential next to the Credential to connect with field. Follow the prompts to link n8n to your Slack account.
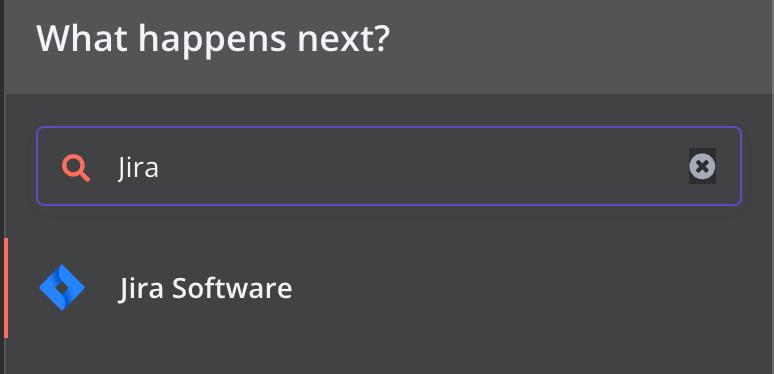
Step 6: Add the Jira Node
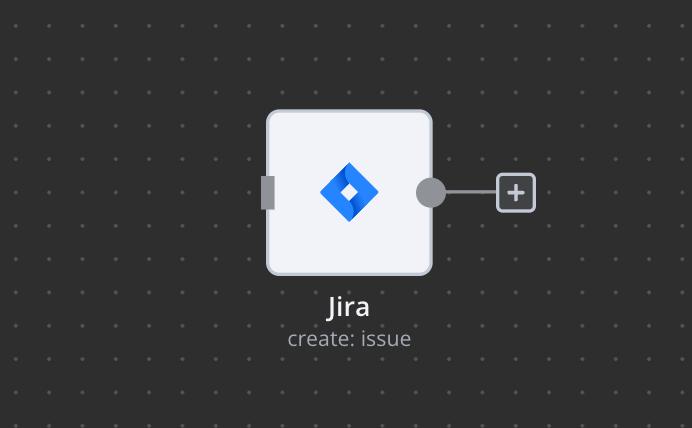
Drag the Jira node from the nodes panel to the workflow canvas. Choose the action you want Jira to perform before dragging, such as creating an issue or updating a task.
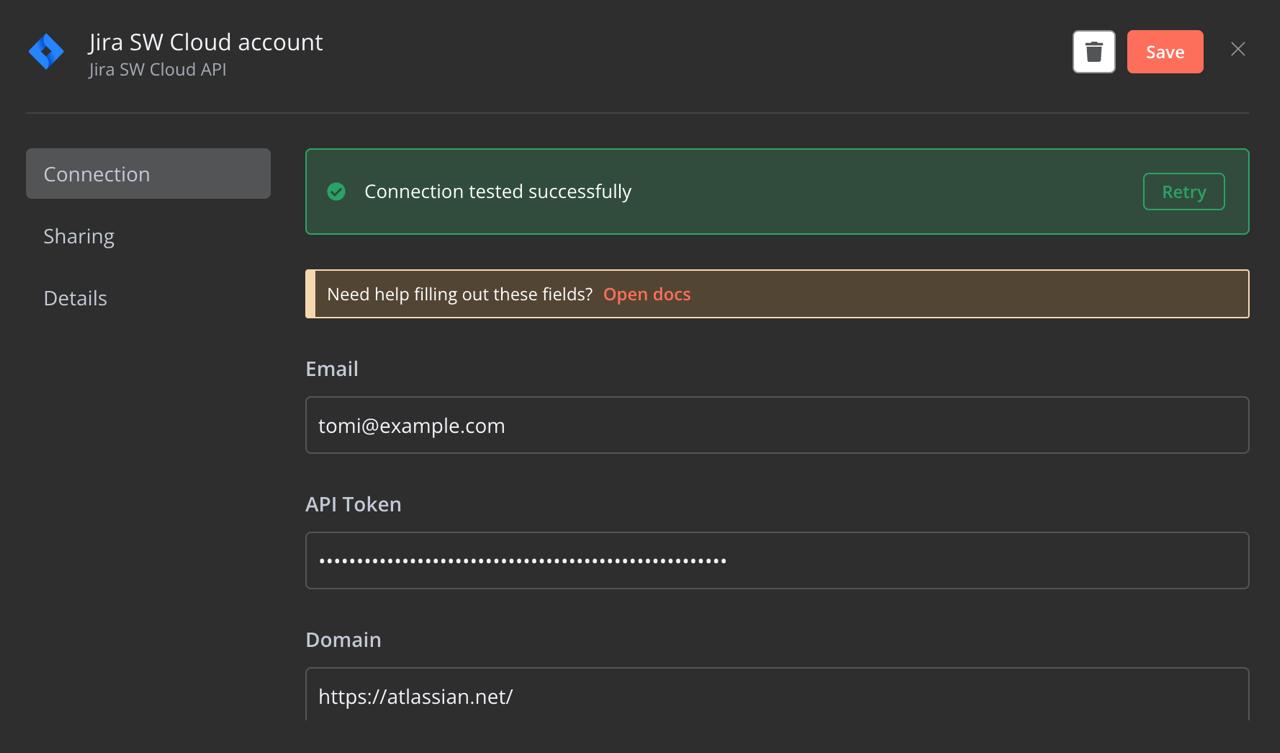
Step 7: Authenticate Jira
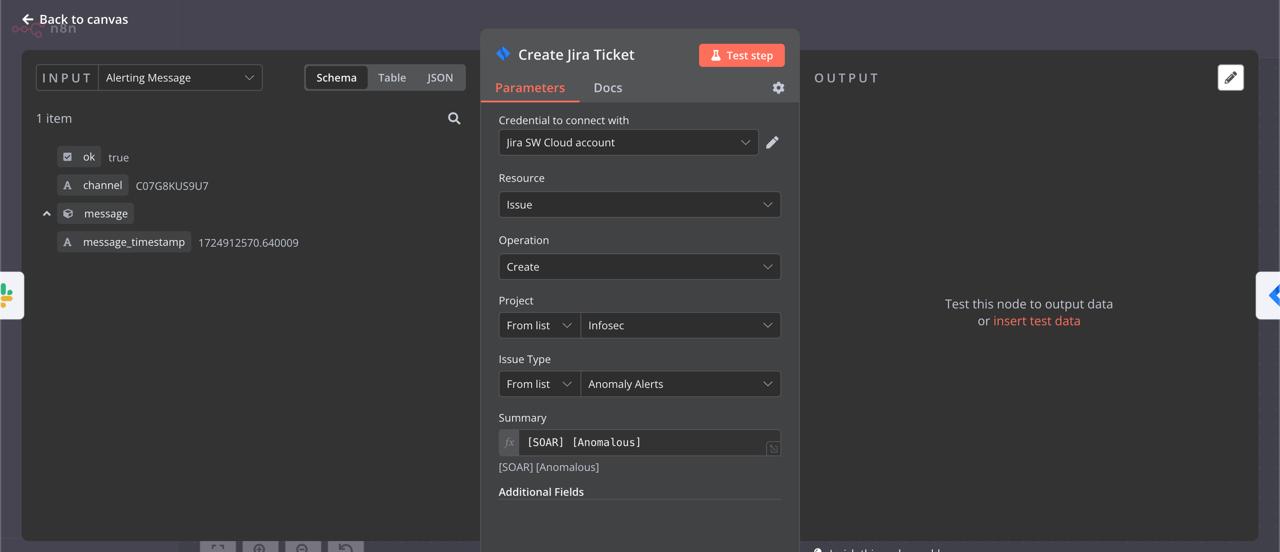
Click on the Jira node, then click the Select credential dropdown option next to the Credential to connect with field. Follow the instructions to connect n8n to your Jira account. Make sure you have the right permissions in Jira to perform the desired actions.
Step 8: Configure Slack and Jira Nodes
Click on each node to adjust settings. On the left, you’ll see the input data. In the middle, set up parameters like resources and operations. The output will appear on the right.
Step 9: Connect Webhook, Slack, and Jira
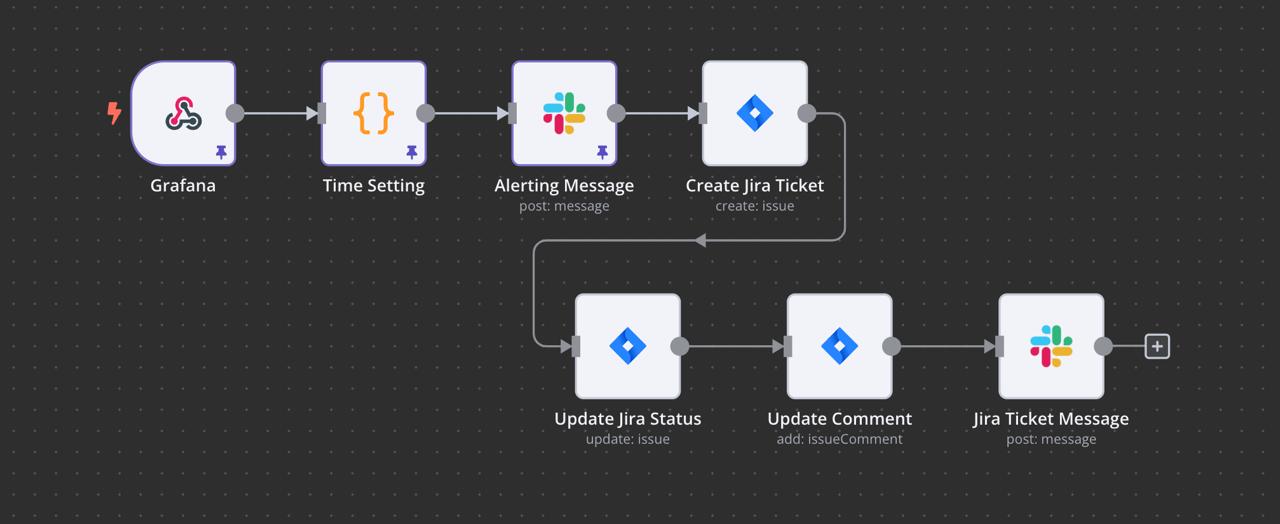
Link the nodes together in the order you need. For example, you can connect Grafana’s Webhook output to Slack, then link Slack’s output to Jira, or rearrange them to fit your workflow.

Step 10: Customize Your Webhook, Slack, and Jira Integration
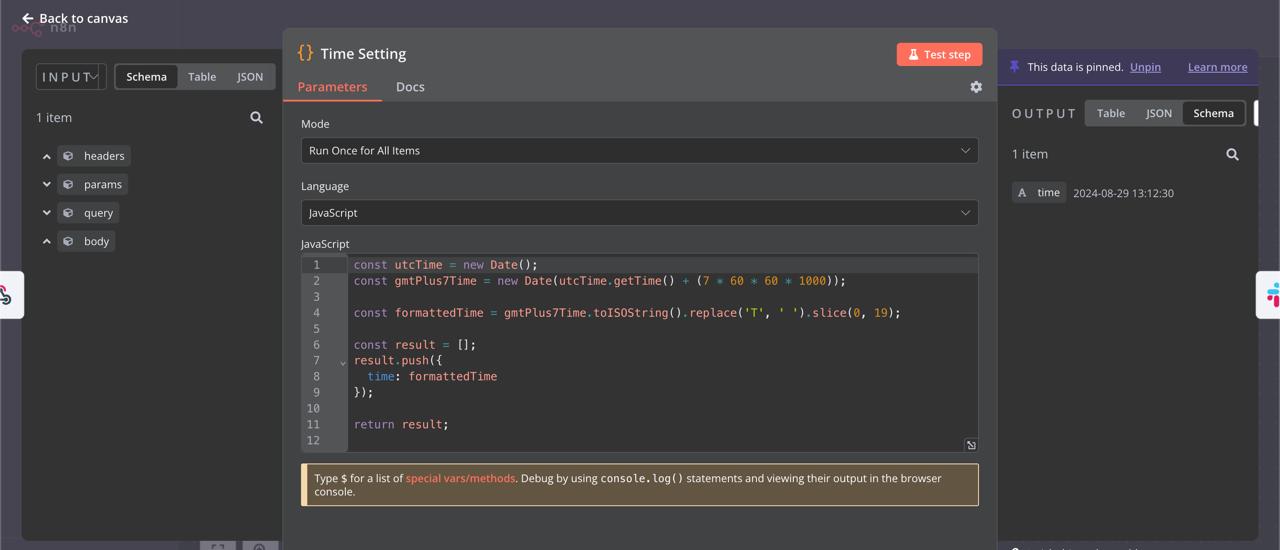
Use n8n’s core nodes to shape the data and extend your setup:
- Splitting: IF, Switch
- Merging: Merge, Compare Datasets
- Looping: IF, Loop Over Items
- Waiting: Wait
- Sub-workflows: Execute Workflow, Execute Workflow Trigger
- Error Handling: Stop And Error, Error Trigger
- Code: Write custom JavaScript or Python code and run it within your workflow.
Step 11: Save and Activate Workflow
After configuring Webhook (Grafana), Slack, Jira, and any extra nodes, save your workflow and activate it. Once active, the workflow will automatically run whenever a trigger node gets input or meets a condition. New workflows start deactivated by default.
Step 12: Test the Workflow
Run the workflow to see if everything’s working between Webhook (Grafana), Slack, and Jira. Depending on your setup, data should move smoothly between them. If something goes wrong, you can debug by checking past runs to spot and fix mistakes.
Wrap-Up
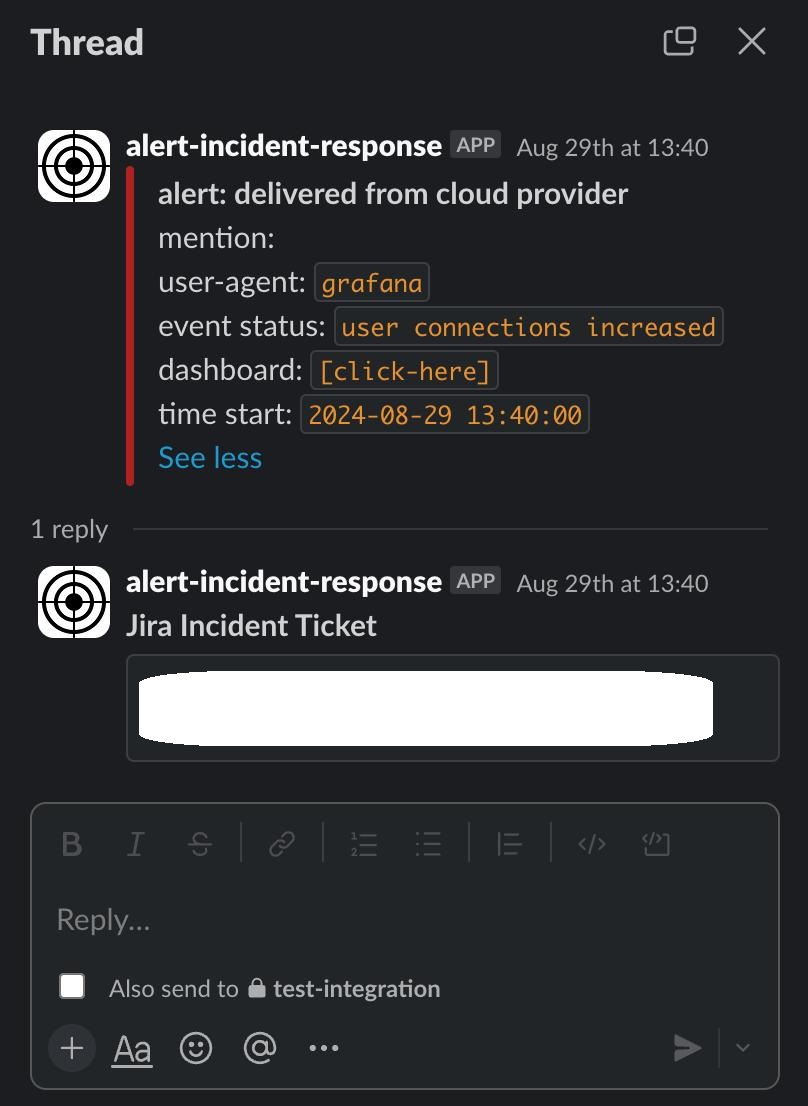
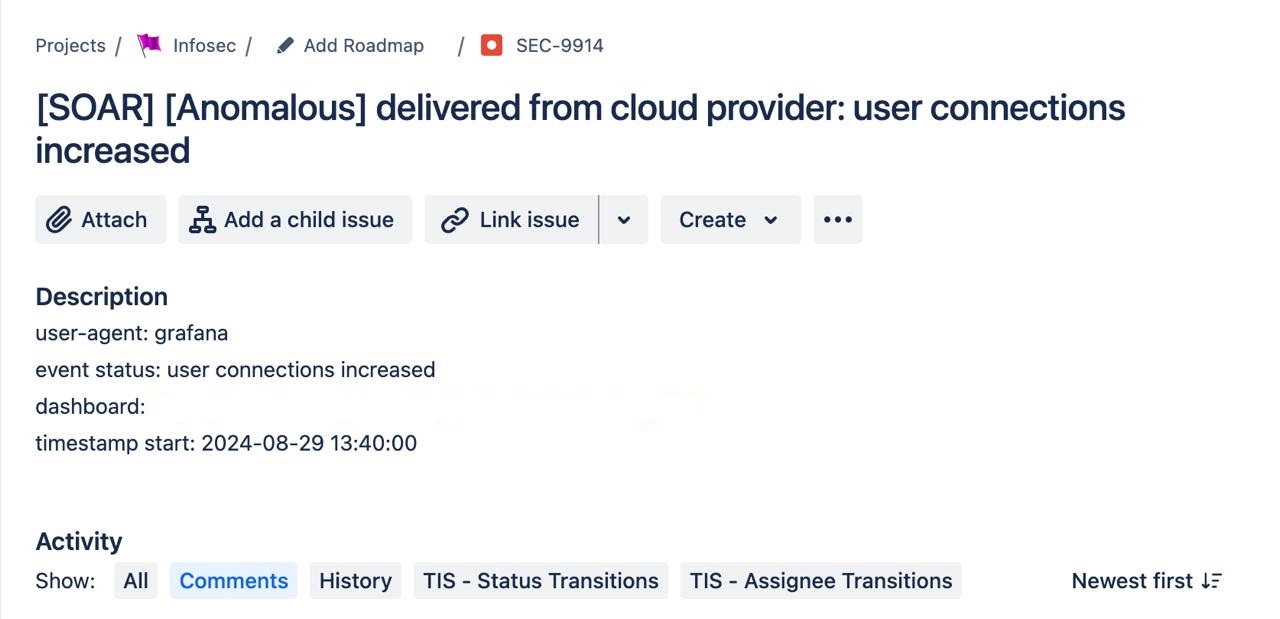
Setting up Grafana alerts and integrating with tools like Slack and Jira boosts your monitoring and incident management by automating notifications and streamlining responses to critical issues. With your alerts, contact points, and notification policies in place, your setup is ready to keep you informed and proactive. Experiment with conditions, refine alerts, and customize integrations to fit your needs. This powerful combo helps you stay on top of your data, tackle issues before they escalate, and keep everything running smoothly.
Happy monitoring, and may your alerts always be insightful!